Customer Churn Rate in Retail Chains. Strategies for Achieving the Optimal Level
Using Customer Churn Analysis you'll reduce revenue loss, increase competitiveness, improve customer retention and customer experience

No retailer wants to lose its customers. However, establishing and maintaining customer loyalty can be a challenging endeavor. Suddenly, one day, a customer simply ceases to make purchases at your stores.
Imagine this scenario: a customer used to frequent your store twice a week, spending $100 each time. Fast-forward a year later, their visits have dwindled to once a month, and their expenses have significantly reduced to $50 per purchase. The risk of losing this customer permanently is imminent.
So, what's next? Will you shift your focus toward acquiring new customers? Or do you opt to delve into analyzing the potential reasons behind this churn?
Retailers must ascertain the number of departing customers and understand the reasons behind their decision to cease buying from the store.
What is the Customer Churn Rate?
Customer churn is a metric that measures the number of customers who have not made a repeat purchase within a specific period. It is a crucial metric that directly impacts the profitability of your business.
The customer churn rate is also known as the customer loss rate. It indicates the frequency that customers stop interacting with a company over a given period. Almost every business faces the problem of churn, especially in these unstable times. The key focus lies in understanding the extent of customer churn and what revenue losses it causes.
Customer Churn Analysis
To gain valuable insights into customer behavior and effectively analyze their purchasing patterns, businesses rely on Business Intelligence (BI) tools.
BI tools are used to quickly analyze the size and structure of the loyalty program's customer base. One of the reports from Datawiz's BI solution, “Loyalty Program Statistics” is focused on customer analysis, conversion tracking, and customer churn.
The Loyalty Program Statistics report encompasses a wealth of information concerning loyalty program customers, including:
- Total number of loyal customers
- Number of new customers
- Demographic data
- Frequency of visits
- Conversion rate
- Sales indicators, such as turnover, profit, average receipt, number of receipts, and more
- Customer churn
- Sales funnel analysis for new customers

With this data, marketers can analyze sales, manage loyalty programs, and implement effective marketing activities.
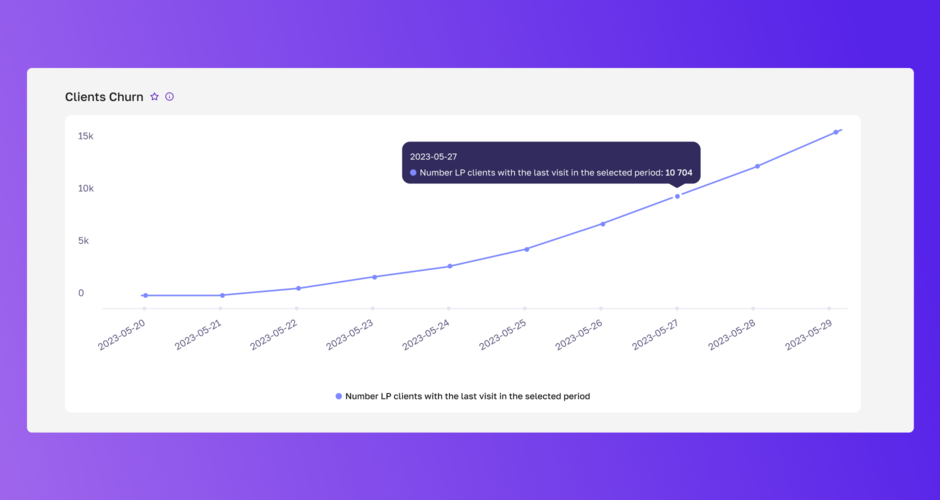
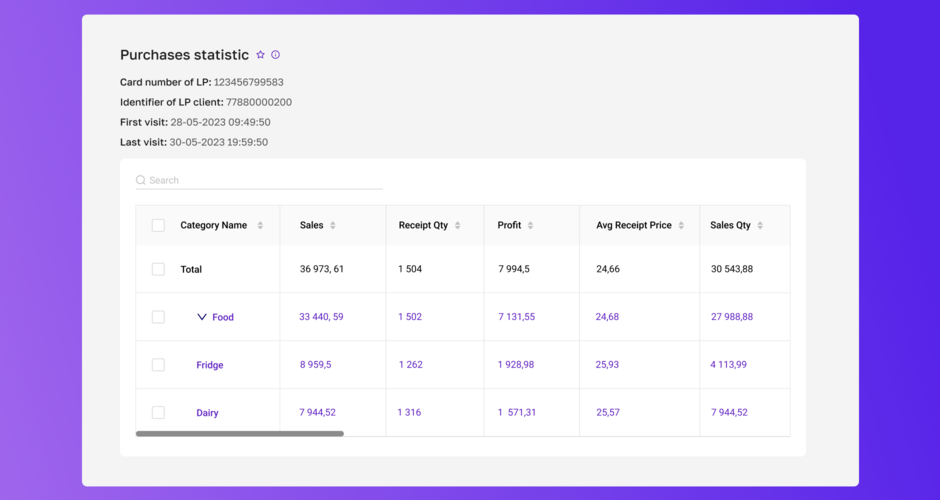
The Customer Churn tab of the report contains data on purchases made by customers who last visited the store within a certain period. This data is structured and presented in an intuitively understandable visualization and table format with information about the purchases.
The visualization of customer churn shows how many customers made their last purchase each day during the selected period. Additionally, BI algorithms calculate the percentage of lost customers in the loyalty program.

The BI report from Datawiz collects data and shows detailed information about the purchases of loyalty program customers who last visited a chain store.


Another helpful visualization of this report is the sales funnel. It shows the distribution of customers by the number of purchases they make. The sales funnel displays how many customers made the first purchase, and how many of them came back and made repeat purchases.

Additionally, you can see a list of customers who have made repeat purchases in the selected period, as well as a list of purchases made by these customers and the sales performance of categories and products.
The convenient BI dashboard and visualizations of the report allow you to easily view all loyalty customer data and metrics, which you can easily share with your team.
How to calculate the customer churn rate?
There are several ways to calculate it:
A simple formula for Customer Churn Rate:
Customer Churn Rate, % = (Number of churned customers during the period / Number of customers at the beginning of the period) x 100
There are four steps required to calculate the customer churn rate:
Step 1 → Select a period – e.g. monthly, weekly, quarterly, annual
Step 2 → Count the number of customers at the beginning of the period
Step 3 → Count the number of churned customers who have left by the end of the period
Step 4 → Divide the number of churned customers by the number of customers at the beginning of the period
Let's say I want to calculate the monthly customer churn rate. We started the month with 300 loyal customers. 30 customers did not make any purchases during the month.
Churn rate = (30 ÷ 300) × 100% = 10%.
Time-adjusted formula
Customer churn rate, % = (Y / [ (W+X) / 2 ] ) x 100
W = Number of customers at the beginning of the period
X = Number of customers at the end of the period
Y = Number of customers churned within the period
This more complex formula is suitable for chains that are growing rapidly and attracting many new customers.
What Customer Churn Rate Can be Considered Normal?
In an ideal world, stores do not lose any customers and have 0% churn. But in reality, churn rarely reaches zero.
According to research, the average annual churn rate is about 5-7%. This means that approximately 5-7% of customers stop interacting with the supermarket during the year, while the remaining 93-95% continue to be active customers. Retail chains that have been on the market for more than 10 years usually have a lower churn rate than younger companies.
In some industries, customer churn is higher than in others, especially in the discounters market, where customers are focused on a good deal and go where they find the lowest prices. Other businesses experience higher churn rates at certain times of the year, such as bakeries, which tend to be busier during the holiday season.
Why is Churn Analysis Important?
-
Reducing revenue loss
Once the reasons for churn are identified, chains can take steps to reduce churn and increase revenue. -
Improving customer retention
Churn analysis helps identify ways to improve customer retention and increase customer loyalty. -
Increasing competitiveness
By identifying where chains are losing customers to competitors, companies can take steps to improve their offerings. -
Improving customer experience
By analyzing customer churn, companies identify problematic areas where the product does not meet customer expectations. By understanding these issues, companies can improve their offerings.
Common Mistakes Made When Analyzing Customer Churn
One way to prevent customer loss is to identify customers at high risk of leaving and focus your attention on them: develop a strategy to retain these customers.
Another misconception is that high churn rates are often the result of attracting the wrong customers. Chains that focus only on low prices in their advertising campaigns attract those clients who are looking for discounts. These customers then quickly leave when they find a better deal at another store. Such marketing activities help to attract new customers, but they are usually customers with a high churn rate.
Final words
Customer churn rates in supermarkets depend on many factors, such as the size of the chain, regional competition, quality of service, pricing, and loyalty programs. Data can vary by country, competition, and many other factors.
Use Datawiz BI to analyze processes in retail chains. Find insights to increase loyalty and reduce customer churn!


